Average Monthly Rent in the UK by Region: England, Scotland and Wales Compared
UK private tenants paid an average of £1,411 a month in October 2026. See average rents and one-bed costs in every region, from London to the North East.

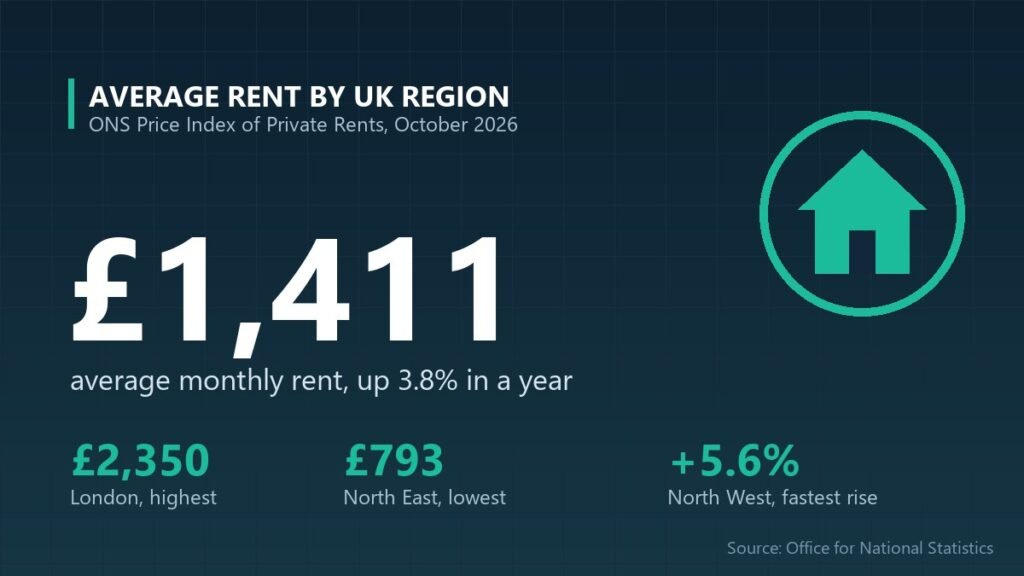
The average monthly rent in the UK by region ranges from £793 in the North East to £2,350 in London, according to the Office for National Statistics. Across the UK, private tenants paid an average of £1,411 a month in October 2026, up 3.8 per cent (£51) on a year earlier. Annual rent growth was unchanged from September and is still running well ahead of house prices, which rose 1.2 per cent, and the North West now has the fastest-rising rents in England. Below we compare every English region and UK nation, part of our UK property market data.
Key takeaways
- UK average rent: £1,411 a month in October 2026, up 3.8% on a year earlier.
- Most expensive: London at £2,350 a month, almost three times the North East.
- Cheapest: the North East at £793 a month.
- Fastest rises: the North West (+5.6%); slowest: Scotland (+0.7%), its joint-lowest rate on record.
What is the average monthly rent in the UK by region?
London has the highest average rent in the UK at £2,350 a month, while the North East has the lowest at £793. The table shows average private rents for every English region and UK nation, with monthly and annual changes.
| Region / nation | Average monthly rent (Oct 2026) | Monthly change | Annual change |
|---|---|---|---|
| London | £2,350 | +0.5% | +3.8% |
| South East | £1,448 | +0.7% | +3.9% |
| East of England | £1,302 | +0.3% | +3.7% |
| South West | £1,254 | +0.3% | +3.3% |
| Scotland | £1,015 | +0.3% | +0.7% |
| West Midlands | £983 | 0.0% | +3.7% |
| North West | £979 | +0.4% | +5.6% |
| East Midlands | £928 | +0.1% | +3.5% |
| Northern Ireland* | £876 | −0.4% | +1.2% |
| Yorkshire and The Humber | £872 | +0.5% | +4.7% |
| Wales | £849 | +0.1% | +3.9% |
| North East | £793 | +0.4% | +4.9% |
| England | £1,472 | +0.4% | +4.0% |
| United Kingdom | £1,411 | +0.4% | +3.8% |
*Northern Ireland figures are for August 2026, the latest available. The two most recent months are provisional and may be revised.
How much is a one-bedroom flat to rent in each region?
The average one-bedroom home in the UK rents for £1,145 a month, ranging from £557 in the North East to £1,774 in London. Two-bedroom homes average £1,293 a month across the UK.
| Region / nation | 1 bedroom | 2 bedrooms | 3 bedrooms | 4+ bedrooms |
|---|---|---|---|---|
| London | £1,774 | £2,251 | £2,666 | £3,672 |
| South East | £1,007 | £1,293 | £1,578 | £2,248 |
| East of England | £902 | £1,156 | £1,408 | £1,994 |
| South West | £836 | £1,073 | £1,309 | £1,887 |
| West Midlands | £712 | £887 | £1,054 | £1,486 |
| North West | £708 | £891 | £1,068 | £1,513 |
| Scotland | £704 | £915 | £1,171 | £1,952 |
| East Midlands | £653 | £832 | £1,001 | £1,414 |
| Wales | £637 | £782 | £893 | £1,252 |
| Yorkshire and The Humber | £619 | £776 | £923 | £1,333 |
| North East | £557 | £701 | £841 | £1,224 |
| United Kingdom | £1,145 | £1,293 | £1,443 | £2,097 |
Figures are for October 2026. A breakdown by bedrooms is not available for Northern Ireland in the latest month.
How much of your salary goes on rent?
In London, the average rent takes about 53 per cent of typical full-time pay, compared with around 26 per cent in the North East. Briton News compared each region’s average annual rent with its median full-time salary from the ONS earnings survey (April 2026).
| Region / nation | Annual rent | Median full-time salary | Rent as share of gross pay |
|---|---|---|---|
| London | £28,200 | £53,132 | 53.1% |
| South East | £17,376 | £41,664 | 41.7% |
| East of England | £15,624 | £40,531 | 38.5% |
| South West | £15,048 | £39,078 | 38.5% |
| West Midlands | £11,796 | £38,628 | 30.5% |
| North West | £11,748 | £38,599 | 30.4% |
| East Midlands | £11,136 | £36,975 | 30.1% |
| Scotland | £12,180 | £41,466 | 29.4% |
| Yorkshire and The Humber | £10,464 | £37,519 | 27.9% |
| Northern Ireland | £10,512 | £38,203 | 27.5% |
| Wales | £10,188 | £37,330 | 27.3% |
| North East | £9,516 | £36,460 | 26.1% |
This is a rough guide: it uses gross (pre-tax) pay for one full-time earner, so households with two incomes, or where rent is shared, will spend a smaller share.
Why do rents vary so much across the UK?
Rents follow local wages, the shortage of homes to let and how many people are competing for them. London’s average rent is almost three times the North East’s because demand from workers and students far outstrips the supply of homes to let, and because an average house price of £545,579 puts buying out of reach for many.
The fastest growth is now in more affordable northern regions. Rents in the North West rose 5.6 per cent over the year, followed by the North East (4.9 per cent) and Yorkshire and The Humber (4.7 per cent), as tenants priced out of the south look further afield and supply stays tight. Scotland is the exception: rents there rose just 0.7 per cent, the joint-lowest annual rate since the series began in 2016, although the ONS advises caution because Scottish data has historically focused on new lets.
Where are the most and least expensive places to rent?
Kensington and Chelsea in London is the most expensive place to rent in the UK, at £3,765 a month on average. The cheapest is Dumfries and Galloway in Scotland, at £553 a month. Outside London, Oxford has the highest average rent, at £1,956 a month.
Frequently asked questions
What is the average rent in the UK right now?
The average private rent in the UK was £1,411 a month in October 2026, according to the ONS Price Index of Private Rents. That is 3.8 per cent higher than a year earlier, a rise of £51 a month. In England the average was £1,472, in Scotland £1,015 and in Wales £849.
Which region has the cheapest rent in the UK?
The North East of England has the cheapest rents, averaging £793 a month in October 2026. Wales (£849) and Yorkshire and The Humber (£872) are next. A one-bedroom home in the North East costs an average of £557 a month, compared with £1,774 in London.
Are rents still going up in the UK?
Yes. UK rents rose 3.8 per cent in the year to October 2026, unchanged from September. Growth was strongest in the North West at 5.6 per cent and weakest in Scotland at 0.7 per cent. Wales peaked at 8.9 per cent in March 2025 and is now 3.9 per cent.
Methodology and official sources
- Source: Office for National Statistics, Private rent and house prices, UK: November 2026, released 18 November 2026, and the dataset Price Index of Private Rents, UK: monthly price statistics (18 November 2026 edition).
- Reference period: October 2026 for England, Wales and Scotland; August 2026 for Northern Ireland. The latest two months are provisional.
- Coverage: England and Wales figures reflect rents for new and existing tenancies; Scotland and Northern Ireland are mainly advertised new lets, so the ONS advises care when comparing countries.
- Rent-to-pay comparison: Briton News calculation using annualised average rents and median full-time annual pay from the ONS Annual Survey of Hours and Earnings 2026 (provisional, ASHE Table 3).
- Next update: 16 December 2026.
- Links: ONS: Private rent and house prices, UK: November 2026 and Price Index of Private Rents dataset.