Average Salary in the UK by Age Group: When British Earnings Peak
Full-time pay in the UK peaks at £46,280 for 40 to 49 year olds. See the median salary for every age group, for men and women, from the latest ONS data.

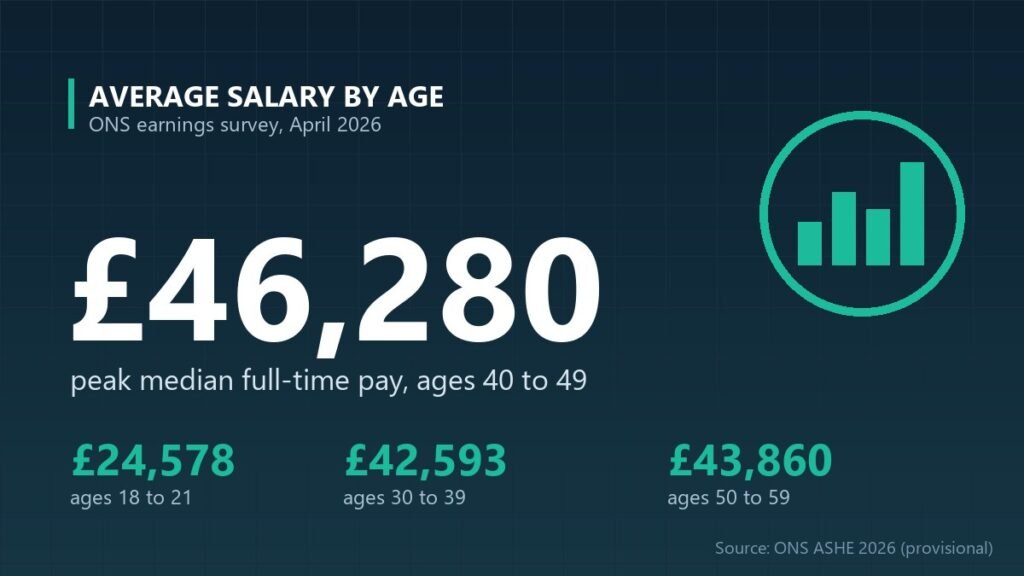
The average salary in the UK by age climbs steeply through your twenties and thirties and peaks in your forties, according to the Office for National Statistics. Full-time employees aged 40 to 49 earn a median of £46,280 a year, the highest of any age group, compared with £24,578 for those aged 18 to 21 and £40,911 across all full-time workers. Pay then eases off from your fifties. Below we break down typical earnings for every age group, for men and women, part of our UK money and tax data coverage.
Key takeaways
- Peak earnings: £46,280 a year at ages 40 to 49 (full-time median, April 2026).
- Youngest adults: £24,578 at ages 18 to 21, just over half the peak.
- Biggest jump: pay rises 26.5% between the 22 to 29 and 30 to 39 age groups.
- Gender gap widens with age: from 6.6% at 18 to 21 to 17.1% at 50 to 59.
What is the average salary in the UK by age?
Full-time employees in their forties earn the most, with a median salary of £46,280 a year in April 2026. The table shows median annual and weekly full-time pay for each age group, with the change on 2025.
| Age group | Median annual pay (full-time) | Annual change | Median weekly pay (full-time) | Weekly pay change |
|---|---|---|---|---|
| 18 to 21 | £24,578 | +4.9% | £522.50 | +4.9% |
| 22 to 29 | £33,678 | +4.1% | £676.80 | +4.5% |
| 30 to 39 | £42,593 | +4.4% | £855.90 | +6.0% |
| 40 to 49 | £46,280 | +3.9% | £921.30 | +5.6% |
| 50 to 59 | £43,860 | +4.4% | £876.90 | +5.2% |
| 60 and over | £38,060 | +4.2% | £766.60 | +5.5% |
| All ages | £40,911 | +4.5% | £811.20 | +5.8% |
Annual figures cover full-time employees on adult rates who have been in the same job for at least a year. Estimates for 16 and 17 year olds are not published for annual pay because sample sizes are too small. All 2026 figures are provisional.
At what age do UK salaries peak?
UK salaries peak between the ages of 40 and 49. At that stage, the median full-time salary of £46,280 is almost double (1.9 times) the £24,578 earned by 18 to 21 year olds, and £5,369 above the all-age median.
The steepest rise comes earlier. Median pay jumps 26.5 per cent between the 22 to 29 age group (£33,678) and the 30 to 39 age group (£42,593), as workers gain experience, qualifications and promotions. Growth slows in the forties, and from 50 onwards typical pay starts to fall, reaching £38,060 for full-time workers aged 60 and over.
Why does pay fall after 50?
Lower median pay among older workers does not usually mean individuals take pay cuts. It is more likely to reflect who is still working full-time. Some higher earners retire early or move to part-time or self-employed work, while others step back from senior roles, change careers or take less demanding jobs as they approach retirement. The mean (average) salary tells a similar story: it is highest at 40 to 49 (£58,785) and only slightly lower at 50 to 59 (£58,130).
How does the average salary by age differ for men and women?
Men earn more than women at every age, and the gap grows wider over a career. At 18 to 21 the difference in median full-time pay is £1,668 (6.6 per cent), but by 50 to 59 it is £8,127 (17.1 per cent).
| Age group | Men (full-time median) | Women (full-time median) | Gap |
|---|---|---|---|
| 18 to 21 | £25,328 | £23,660 | 6.6% |
| 22 to 29 | £35,000 | £32,330 | 7.6% |
| 30 to 39 | £45,199 | £39,528 | 12.5% |
| 40 to 49 | £49,702 | £41,516 | 16.5% |
| 50 to 59 | £47,462 | £39,336 | 17.1% |
| 60 and over | £41,081 | £33,536 | 18.4% |
| All ages | £43,934 | £37,471 | 14.7% |
The gap is calculated as the difference between men’s and women’s median annual pay, as a share of men’s pay. The widening from the thirties onwards coincides with the years when many people start families. Differences in the jobs men and women do, and in working patterns, are also commonly cited reasons for the gap.
Am I earning a good salary for my age?
A simple check is to compare your full-time salary with the median for your age group: if you earn more, you are paid above the typical full-time worker your age. For example, a 25-year-old earning £36,000 is above the £33,678 median for 22 to 29 year olds, while a 45-year-old on the same salary is below the £46,280 median for their age.
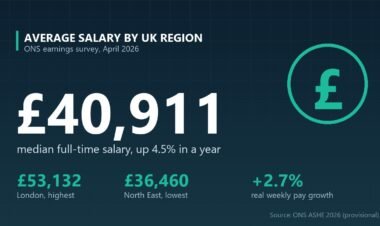
Bear in mind that these are national figures. Pay is much higher in London, where the median full-time salary is £53,132, and lower in regions such as the North East (£36,460), so comparing yourself with workers in your own area and industry gives a fairer picture.
Frequently asked questions
What is the average salary for a 30-year-old in the UK?
Full-time employees aged 30 to 39 earned a median of £42,593 a year in April 2026, according to the ONS. That is slightly above the all-age full-time median of £40,911. Men in this age group earned a median of £45,199 and women £39,528. Weekly full-time pay for 30 to 39 year olds was £855.90.
What is the average salary for a 25-year-old in the UK?
The ONS publishes pay for the 22 to 29 age group rather than single years. Full-time employees in this group earned a median of £33,678 a year in April 2026, up 4.1 per cent on 2025. Those aged 18 to 21 earned a median of £24,578.
At what age do you earn the most in the UK?
People earn the most in their forties. Full-time employees aged 40 to 49 had the highest median salary of any age group in April 2026, at £46,280 a year. Median pay then falls to £43,860 for those aged 50 to 59 and £38,060 for those aged 60 and over.
Methodology and official sources
- Source: Office for National Statistics, Employee earnings in the UK: 2026 (Annual Survey of Hours and Earnings), released 22 October 2026.
- Dataset: ASHE Table 6 (age group), 2026 provisional: Table 6.7a (annual gross pay) and Table 6.1a (weekly gross pay), full-time employees, UK.
- Reference period: pay period including 22 April 2026. Full-time means more than 30 paid hours a week (25 or more for teachers).
- Gender gap by age: Briton News calculation from median annual full-time pay for men and women. The ONS headline gender pay gap uses hourly pay excluding overtime, so it differs from these figures.
- Link: ONS: Age group, ASHE Table 6.