How Many EV Charging Points Are in the UK? Every Region Compared
There were 121,171 public EV chargers in the UK on 1 July 2026. See how every English region and UK nation compares, from London to Northern Ireland.

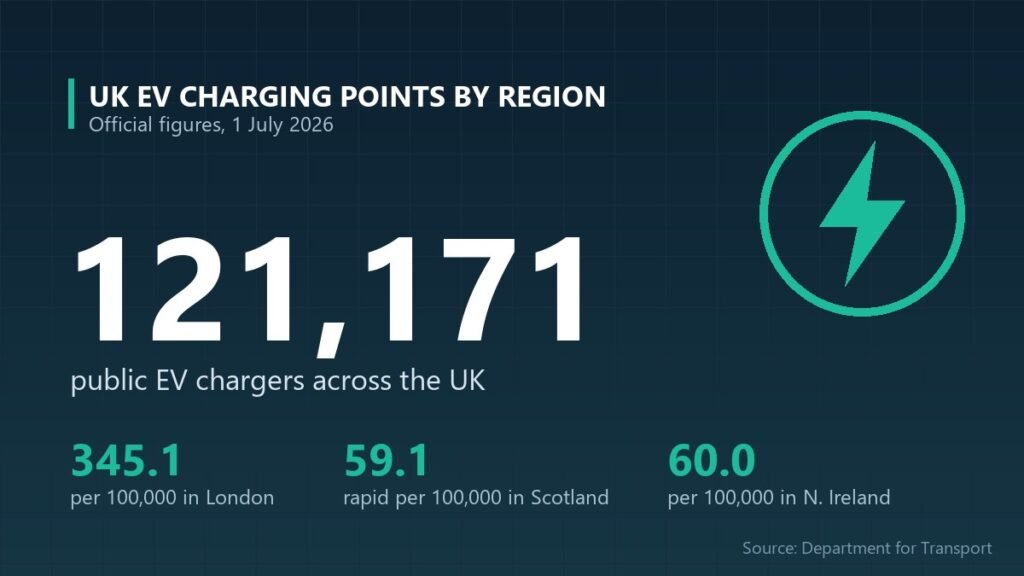
So, how many EV charging points are in the UK? According to the Department for Transport’s official statistics, there were 121,171 public electric vehicle chargers on 1 July 2026, equal to 174.9 for every 100,000 people. That is 11,039 more than a year earlier, a rise of 10 per cent. Growth is far from even, though. London has almost six times as many chargers per head as Northern Ireland, while Scotland leads the UK for rapid charging. Below, we compare every English region and UK nation using the latest DfT data, part of our wider coverage of how UK public services compare where you live.
Key takeaways
- UK total: 121,171 public EV chargers on 1 July 2026, or 174.9 per 100,000 people.
- Highest: London, with 31,371 chargers and 345.1 per 100,000 people.
- Lowest: Northern Ireland, with 1,156 chargers and 60.0 per 100,000 people.
- Annual change: up 10.0 per cent on July 2025, while rapid chargers (50kW and above) rose 16.4 per cent.
How many EV charging points are there in the UK by region?
London has the most public EV charging points of any UK region, both in total and per person, while Northern Ireland has the fewest. The table shows the number of public chargers in each English region and UK nation on 1 July 2026, with the change over the previous quarter and the previous year.
| Region / nation | Public chargers (1 Jul 2026) | Per 100,000 people | Quarterly change (since 1 Apr 2026) | Annual change (since 1 Jul 2025) |
|---|---|---|---|---|
| London | 31,371 | 345.1 | +462 (+1.5%) | +3,965 (+14.5%) |
| Scotland | 12,847 | 231.6 | +175 (+1.4%) | +777 (+6.4%) |
| Wales | 5,910 | 185.5 | +198 (+3.5%) | +673 (+12.9%) |
| West Midlands | 10,143 | 163.9 | +84 (+0.8%) | +411 (+4.2%) |
| South East | 15,373 | 159.4 | +623 (+4.2%) | +902 (+6.2%) |
| South West | 9,232 | 156.7 | +165 (+1.8%) | +802 (+9.5%) |
| North East | 4,147 | 150.2 | +161 (+4.0%) | +595 (+16.8%) |
| East of England | 9,880 | 150.2 | −7 (−0.1%) | +982 (+11.0%) |
| East Midlands | 6,153 | 121.5 | −110 (−1.8%) | +876 (+16.6%) |
| North West | 8,678 | 112.2 | +302 (+3.6%) | +874 (+11.2%) |
| Yorkshire and The Humber | 6,281 | 110.7 | +27 (+0.4%) | +79 (+1.3%) |
| Northern Ireland | 1,156 | 60.0 | +11 (+1.0%) | +103 (+9.8%) |
| United Kingdom | 121,171 | 174.9 | +2,091 (+1.8%) | +11,039 (+10.0%) |
Changes are calculated from the DfT’s published quarterly counts. The small quarterly falls in the East Midlands and East of England need care: in June 2026, one charge point operator removed around 1,270 private chargers that had been wrongly listed as public, which the DfT says affects comparisons between April and July.
Why are there regional differences in EV charging points?
Charger numbers mostly follow where people live, how they park and where public money has gone. The biggest gaps come down to three things.
Housing and parking. London’s lead comes largely from on-street charging. Many Londoners live in flats or terraced homes without a driveway, so boroughs have installed lamp-post and kerbside chargers on residential streets. These are mostly slower units, which explains why the capital tops the table for total chargers while ranking second-lowest in the UK for rapid charging. You can follow these developments in our UK transport and EV charging coverage.
Long-term public investment. Scotland’s strong position, especially for rapid chargers, reflects years of publicly funded investment in a national network, including along trunk roads and in rural areas where distances between towns are long.
Population spread and network scale. Northern Ireland has the smallest network and the lowest rate per person for both standard and rapid chargers. In England, Yorkshire and The Humber has the lowest rate per head and grew by just 1.3 per cent over the year, compared with almost 17 per cent in the North East and East Midlands.
How does this compare with a year ago?
The UK added 11,039 public chargers between 1 July 2025 and 1 July 2026, a 10.0 per cent increase. Rapid and ultra-rapid chargers grew faster, up 16.4 per cent to 28,887, so they now make up around 24 per cent of the public network.
The fastest annual growth in total chargers was in the North East (16.8 per cent), the East Midlands (16.6 per cent) and London (14.5 per cent). For rapid chargers alone, the East Midlands grew most, by 33.7 per cent, followed by the North East (26.8 per cent) and Northern Ireland (24.0 per cent).
Where is rapid EV charging easiest to find?
Scotland has the most rapid chargers per person, with 59.1 rapid-or-faster (50kW and above) chargers per 100,000 people, against a UK average of 41.7.
| Region / nation | Rapid chargers (50kW+) per 100,000 people |
|---|---|
| Scotland | 59.1 |
| South West | 49.5 |
| East of England | 48.8 |
| East Midlands | 46.7 |
| West Midlands | 45.7 |
| Wales | 42.8 |
| North West | 40.0 |
| South East | 39.7 |
| North East | 37.1 |
| Yorkshire and The Humber | 36.6 |
| London | 27.9 |
| Northern Ireland | 19.3 |
Rapid chargers matter most for long journeys and for drivers who cannot charge at home. Regions crossed by major routes, such as the South West and East of England, score well, while dense urban London relies more on slower kerbside charging.
What does this mean for drivers in London?
Londoners are more likely than anyone in the UK to find a public charger near home, but less likely to find a rapid one. With 345.1 chargers per 100,000 people, most residential streets in many boroughs are within reach of a kerbside point, which suits overnight charging. For a quick top-up, though, drivers in the capital have the second-lowest number of rapid chargers per person of any UK region, so planning matters for longer trips.
Are there enough public chargers for the number of electric cars?
On the DfT’s latest measure, there was one public charger for every 17 battery electric vehicles in the UK, based on chargers and vehicle numbers at 1 April 2026. Most electric car owners with a driveway do most of their charging at home, so the public network matters most for flat-dwellers, long-distance drivers and fleets.
Frequently asked questions
How many EV charging points are there in the UK?
There were 121,171 public electric vehicle chargers in the UK on 1 July 2026, according to the Department for Transport. That works out at 174.9 chargers for every 100,000 people, and 28,887 of them were rapid or ultra-rapid units rated at 50kW or above.
Which region has the most EV charging points?
London has the most public EV chargers, with 31,371 on 1 July 2026, or 345.1 per 100,000 people. However, most are slower kerbside units. For rapid chargers per person, Scotland leads the UK with 59.1 per 100,000 people, more than twice London’s rate of 27.9.
How often are UK EV charger figures updated?
The Department for Transport publishes official public charging statistics every quarter, using data collated by Zapmap. The figures in this article cover 1 July 2026 and were published on 27 August 2026. The next release, covering 1 October 2026, has been announced, and we will update this page when it is out.
Methodology and official sources
- Publisher: Department for Transport (DfT), Electric vehicle charging infrastructure statistics: 1 July 2026 (official statistics in development), published 27 August 2026.
- Dataset: table EVCI0101, Public electric vehicle chargers by country and region: United Kingdom, 1 July 2026, with counts at 1 July 2025, 1 April 2026 and 1 July 2026. Quarterly and annual changes are calculated by Briton News from these counts.
- Data collection: charger data supplied by charge point operators and collated by Zapmap for the DfT. Figures count individual public chargers (connectors that can charge a vehicle) operational at 00:00 on the reporting date.
- Population: per 100,000 figures use Office for National Statistics mid-year population estimates for 2024.
- Caveats: regional data before January 2026 is described by the DfT as an indication of growth over time. In June 2026, one operator removed around 1,270 private chargers wrongly listed as public, which affects April-to-July comparisons.
- Sources: DfT public EV charging infrastructure statistics, 1 July 2026 and EVCI data tables.