NHS Waiting Times by Region: How Long Are NHS Waiting Lists Now?
7.4 million treatment pathways were waiting in England in September 2026. See waiting lists, 18-week performance and A&E waits for every NHS region.

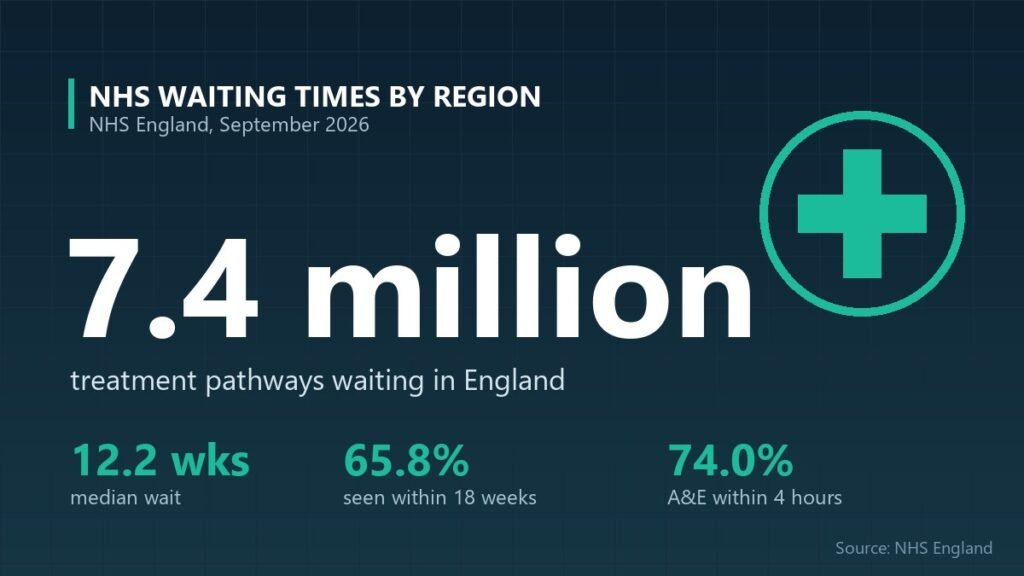
How long are NHS waiting lists now? In England, 7.4 million treatment pathways were waiting to start hospital treatment at the end of September 2026, involving an estimated 6.2 million patients, according to NHS England. The typical (median) wait was 12.2 weeks, and 65.8 per cent of patients had been waiting less than 18 weeks, well short of the 92 per cent standard. Waits vary sharply by region: patients in the East of England are two and a half times as likely to have waited over a year as those in London. Here is how every NHS region compares, part of our coverage of how UK public services perform where you live.
Key takeaways
- Waiting list: 7.4 million pathways (about 6.2 million patients) at the end of September 2026.
- Within 18 weeks: 65.8% nationally, up 4.0 points on a year earlier but below the 92% standard.
- Best region: London, with 68.7% seen within 18 weeks; worst: the East of England at 62.7%.
- A&E: 74.0% of patients were dealt with within four hours in October 2026, against a 95% standard.
How long are NHS waiting lists in each region?
London and the North East and Yorkshire have the shortest hospital waits in England, while the East of England has the longest. The table shows waiting times for consultant-led treatment by NHS England region at the end of September 2026.
| NHS region | Pathways waiting | Within 18 weeks | Median wait | Waiting over 52 weeks |
|---|---|---|---|---|
| London | 1,165,302 | 68.7% | 11.6 weeks | 11,594 (1.0%) |
| North East and Yorkshire | 961,584 | 68.3% | 11.4 weeks | 13,443 (1.4%) |
| South West | 589,239 | 67.7% | 11.7 weeks | 7,295 (1.2%) |
| Midlands | 1,221,121 | 65.2% | 12.4 weeks | 16,340 (1.3%) |
| North West | 978,710 | 65.2% | 12.3 weeks | 14,028 (1.4%) |
| South East | 1,109,071 | 64.2% | 12.7 weeks | 22,507 (2.0%) |
| East of England | 917,819 | 62.7% | 13.1 weeks | 23,400 (2.5%) |
| England | 7.4 million | 65.8% | 12.2 weeks | 116,353 |
Regional figures are by commissioner and exclude estimates for six trusts that did not submit data for September; the England totals include those estimates. A further 131,478 pathways are commissioned nationally by NHS England and are not assigned to a region. Scotland, Wales and Northern Ireland run their own health services and publish waiting times using different measures, so they are not directly comparable.
Why are NHS waiting times different across regions?
Regional differences mostly reflect how much demand each area’s hospitals face compared with their capacity in staff, beds and operating theatres. The East of England stands out: it has the lowest share of patients treated within 18 weeks (62.7 per cent), the longest median wait (13.1 weeks) and the highest share waiting over a year (2.5 per cent). It also accounts for 1,018 of the pathways waiting more than 78 weeks, the most of any region.
London’s large concentration of hospitals, including major teaching trusts, gives it the best 18-week performance despite having more than a million people waiting. The North East and Yorkshire has the shortest median wait in England, at 11.4 weeks.
Specialty matters too. Nationally, ear, nose and throat (57.1 per cent within 18 weeks), oral surgery (54.5 per cent) and gynaecology (60.1 per cent) have some of the longest waits, while elderly medicine (87.0 per cent) and general internal medicine (77.5 per cent) perform best. Trauma and orthopaedics has the biggest list, with 830,089 pathways waiting.
Is the NHS waiting list going down?
Only slightly. The number of pathways waiting fell by 0.2 per cent (12,283) between September 2025 and September 2026, but the share treated within 18 weeks improved by 4.0 percentage points over the same period. Demand is still rising: new referrals (clock starts) per working day were up 3.5 per cent in the 12 months to September 2026, while completed treatments rose 2.4 per cent.
Very long waits remain. At the end of September, 116,353 patients had waited more than a year, 12,825 more than 65 weeks and 314 more than two years.
How long are A&E waits in each region?
In October 2026, 74.0 per cent of A&E patients in England were admitted, transferred or discharged within four hours, against the 95 per cent standard. At major (type 1) emergency departments the figure was just 60.1 per cent. No trust with a major A&E department met the 95 per cent standard.
| NHS region | A&E attendances (Oct 2026) | Within 4 hours (all A&E) | Within 4 hours (major A&E) | 12-hour waits for a bed |
|---|---|---|---|---|
| London | 445,722 | 76.9% | 62.9% | 10,642 |
| South East | 378,768 | 75.8% | 62.9% | 7,986 |
| North East and Yorkshire | 390,913 | 74.3% | 60.3% | 4,543 |
| East of England | 253,379 | 73.1% | 60.6% | 5,445 |
| Midlands | 461,723 | 72.6% | 58.0% | 13,823 |
| South West | 220,256 | 71.9% | 57.9% | 4,421 |
| North West | 350,238 | 71.6% | 57.7% | 10,980 |
| England | 2,500,999 | 74.0% | 60.1% | 57,840 |
The 12-hour figure counts patients who waited more than 12 hours from a decision to admit them to actually getting a bed. Nationally there were 57,840 such waits in October, 6.5 per cent more per day than a year earlier.
What does this mean for patients?
If you are referred for planned hospital treatment, a wait of around three months is now typical, and roughly one in three patients waits longer than 18 weeks. In England, you have a legal right to start consultant-led treatment within 18 weeks of referral for most conditions, and if that is not possible, to ask to be treated by another provider. Your GP or the NHS e-Referral Service can help you compare waiting times at different hospitals.
Frequently asked questions
How many people are on the NHS waiting list?
There were 7.4 million referral-to-treatment pathways waiting to start treatment in England at the end of September 2026. Because some people are waiting for more than one treatment, NHS England estimates this involves around 6.2 million individual patients. The list was 0.2 per cent smaller than a year earlier.
What is the 18-week NHS target?
The NHS constitution standard says 92 per cent of patients should start consultant-led treatment within 18 weeks of referral. At the end of September 2026, 65.8 per cent of patients in England had been waiting up to 18 weeks, so the standard is not being met, although performance improved by 4.0 points over the year.
Which NHS region has the longest waiting times?
The East of England has the longest waits. At the end of September 2026, only 62.7 per cent of its patients had waited under 18 weeks, the median wait was 13.1 weeks and 2.5 per cent had waited over a year, the highest share of any NHS region in England.
Methodology and official sources
- Waiting lists: NHS England, Referral to treatment (RTT) waiting times data, September 2026, statistical press notice published 12 November 2026, and the Incomplete Commissioner file (region level).
- A&E: NHS England, A&E Attendances and Emergency Admissions, October 2026: statistical commentary and monthly provider data. Regional four-hour figures are Briton News calculations from the provider-level data; our England total matches NHS England’s published 74.0 per cent.
- Coverage: England only. Six trusts did not submit RTT data for September 2026; national totals include NHS England estimates for them.
- Links: NHS England RTT waiting times and NHS England A&E attendances and emergency admissions.