UK Unemployment Rate by Region and Age: Latest Labour Market Breakdown
UK unemployment was 4.6% in July to September 2026, from 2.2% in Northern Ireland to 6.4% in London. See rates for every region and age group.

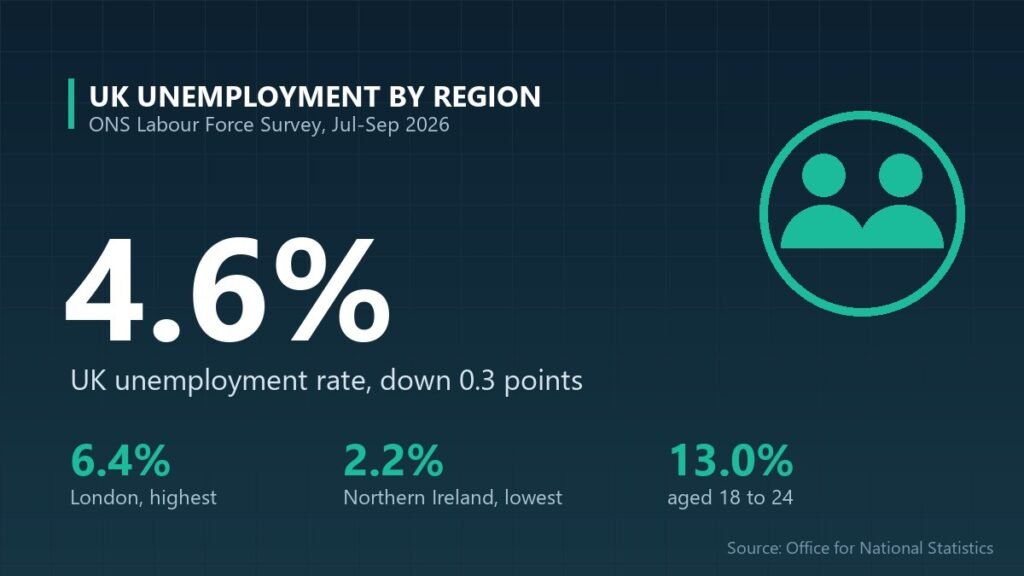
The UK unemployment rate by region and age shows wide gaps beneath the national figure. Across the UK, unemployment was 4.6 per cent in July to September 2026, down 0.3 percentage points on both the quarter and the year, according to the Office for National Statistics. London has the highest rate of any region at 6.4 per cent and Northern Ireland the lowest at 2.2 per cent, while 18 to 24 year olds face an unemployment rate of 13.0 per cent, more than four times that of people in their forties. Here is the full breakdown, part of our UK money and jobs data coverage.
Key takeaways
- UK unemployment rate: 4.6% (about 1.68 million people), July to September 2026.
- Highest region: London at 6.4%, followed by the West Midlands at 5.6%.
- Lowest: Northern Ireland at 2.2%, then Wales (3.4%) and the South West (3.5%).
- Young people: 13.0% of economically active 18 to 24 year olds are unemployed.
What is the UK unemployment rate by region?
London has the highest unemployment rate in the UK at 6.4 per cent, and Northern Ireland the lowest at 2.2 per cent. The table shows unemployment, employment and economic inactivity rates for every English region and UK nation in July to September 2026, with changes on the quarter and the year.
| Region / nation | Unemployment rate | Change on quarter | Change on year | Employment rate (16-64) | Inactivity rate (16-64) |
|---|---|---|---|---|---|
| London | 6.4% | −0.1 | −0.3 | 74.2% | 20.7% |
| West Midlands | 5.6% | 0.0 | −0.4 | 73.0% | 22.5% |
| North East | 5.0% | −0.4 | −0.9 | 70.9% | 25.2% |
| Yorkshire and The Humber | 4.8% | −0.7 | −0.7 | 72.9% | 23.2% |
| Scotland | 4.7% | −0.3 | +1.0 | 74.0% | 22.1% |
| North West | 4.4% | −0.6 | −0.6 | 75.2% | 21.4% |
| East Midlands | 4.3% | −0.8 | −0.9 | 76.9% | 19.7% |
| South East | 4.3% | +0.2 | +0.2 | 78.8% | 17.6% |
| East of England | 4.1% | +0.6 | −0.6 | 77.4% | 19.0% |
| South West | 3.5% | −0.5 | +0.1 | 79.4% | 17.6% |
| Wales | 3.4% | −1.3 | −1.9 | 73.5% | 23.8% |
| Northern Ireland | 2.2% | +0.2 | −0.1 | 72.5% | 25.8% |
| United Kingdom | 4.6% | −0.3 | −0.3 | 75.4% | 20.8% |
Changes are in percentage points. Unemployment rates are for people aged 16 and over as a share of those economically active; employment and inactivity rates are for people aged 16 to 64. The ONS warns that regional estimates are based on smaller samples and that quarterly changes at regional level should be treated with particular caution.
What is the unemployment rate by age?
Unemployment is highest among the youngest workers and falls steadily with age. In July to September 2026, 13.0 per cent of economically active 18 to 24 year olds were unemployed, compared with 3.0 per cent of 35 to 49 year olds and 2.1 per cent of those aged 65 and over.
| Age group | Unemployment rate | Number unemployed | Change on quarter | Change on year |
|---|---|---|---|---|
| 16 to 17 | 34.6% | 157,000 | +4.6 | −0.8 |
| 18 to 24 | 13.0% | 532,000 | −1.7 | +0.2 |
| 25 to 34 | 4.0% | 324,000 | −0.3 | −0.4 |
| 35 to 49 | 3.0% | 367,000 | +0.1 | −0.1 |
| 50 to 64 | 2.7% | 268,000 | −0.2 | −0.4 |
| 65 and over | 2.1% | 38,000 | −0.4 | −0.9 |
| All aged 16+ | 4.6% | 1,684,000 | −0.3 | −0.3 |
The very high rate for 16 and 17 year olds reflects how few in that age group are in the labour market: most are in full-time education, and the rate only counts those working or looking for work. The rates measure unemployment as a share of each age group’s economically active population.
Why is unemployment higher in some regions?
Regional unemployment reflects the local mix of industries, population and skills. London’s high rate sits alongside one of the largest and most fluid labour markets in the UK, with a young population and many people moving between jobs, so at any one time more people are between roles or looking for their first job. The West Midlands and North East have had persistently higher unemployment than the UK average.
A low unemployment rate does not always mean a strong job market. Northern Ireland and Wales have low unemployment but some of the highest economic inactivity rates, at 25.8 and 23.8 per cent respectively, meaning more working-age people are neither working nor looking for work, often because of long-term sickness, caring responsibilities or study. The South West and South East combine low unemployment with the lowest inactivity, at 17.6 per cent each.
Is the UK jobs market getting weaker?
There are mixed signals. The headline unemployment rate fell to 4.6 per cent and the employment rate rose to 75.4 per cent, but other indicators point to a cooling market. Vacancies fell to an estimated 690,000 in August to October 2026, down 37,000 on the year, and the number of payrolled employees was 90,000 lower than a year earlier. The Claimant Count, which includes some people in work on low incomes, rose to 1.714 million in October.
Pay is one bright spot: the latest ONS earnings survey shows median full-time pay rising faster than inflation, as set out in our guide to the average salary in every UK region. Young people’s pay is much lower, as our analysis of average salary by age shows.
Frequently asked questions
What is the current UK unemployment rate?
The UK unemployment rate was 4.6 per cent in July to September 2026, according to the ONS Labour Force Survey published on 17 November 2026. That is down 0.3 percentage points on both the previous quarter and the previous year, with about 1.68 million people unemployed.
Which region has the highest unemployment in the UK?
London had the highest unemployment rate in the UK in July to September 2026, at 6.4 per cent, followed by the West Midlands at 5.6 per cent and the North East at 5.0 per cent. Northern Ireland had the lowest rate at 2.2 per cent, followed by Wales at 3.4 per cent.
What is the youth unemployment rate in the UK?
The unemployment rate for 18 to 24 year olds was 13.0 per cent in July to September 2026, with about 532,000 unemployed. For 16 and 17 year olds it was 34.6 per cent, but most in that age group are in education, so only a small share are in the labour market.
Methodology and official sources
- Source: Office for National Statistics, Labour market overview, UK: November 2026 and Labour market in the regions of the UK: November 2026, both released 17 November 2026.
- Datasets: S01 (regional labour market summary) and A05 SA (employment, unemployment and economic inactivity by age group, seasonally adjusted), July to September 2026.
- Survey: Labour Force Survey, tabulated by region of residence. The ONS advises caution with short-term changes and smaller breakdowns because of sample sizes.
- Next update: 15 December 2026.
- Link: ONS: Labour market in the regions of the UK, November 2026.