Council House Waiting Lists in England: How Long Is the Wait by Region?
1.34 million households were on council housing waiting lists in England in 2025, with London home to a quarter of them. See every region and the longest lists.

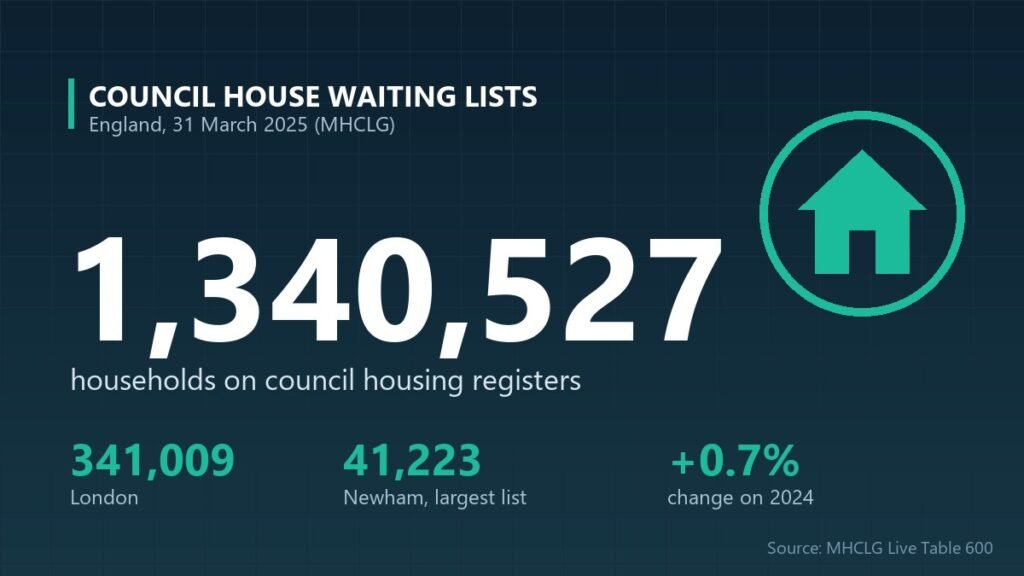
How long is the council house waiting list in England? At 31 March 2025, 1,340,527 households were on local authority housing registers, the official name for council waiting lists, according to the Ministry of Housing, Communities and Local Government. That is up 0.7 per cent on a year earlier and 17.9 per cent higher than in 2020. London accounts for a quarter of the total, with 341,009 households, and Newham alone has more than 41,000. Here is how every English region and the biggest councils compare, part of our UK property and housing data.
Key takeaways
- England total: 1,340,527 households on council housing registers at 31 March 2025.
- Largest region: London, with 341,009 households, or 37.4 per 1,000 residents.
- Biggest rise: the West Midlands, up 9.1% in a year to 127,179.
- Largest council list: Newham, with 41,223 households.
How many people are on council house waiting lists in each region?
London has by far the most households on council waiting lists, both in total and relative to its population, while the South East has the fewest per resident. The table shows households on housing registers in each English region at 31 March 2025.
| Region | Households on waiting list (2025) | Change on 2024 | % change | Per 1,000 residents | Change since 2020 |
|---|---|---|---|---|---|
| London | 341,009 | +4,652 | +1.4% | 37.4 | +35.9% |
| North West | 209,887 | +2,714 | +1.3% | 27.0 | +11.9% |
| Yorkshire and The Humber | 172,536 | +159 | +0.1% | 30.4 | +13.0% |
| South West | 133,231 | +3,111 | +2.4% | 22.6 | +23.1% |
| West Midlands | 127,179 | +10,614 | +9.1% | 20.5 | +30.6% |
| South East | 117,590 | −830 | −0.7% | 12.1 | +5.2% |
| East of England | 91,871 | −2,535 | −2.7% | 13.9 | −2.7% |
| East Midlands | 84,013 | −2,988 | −3.4% | 16.5 | +3.0% |
| North East | 63,211 | −4,972 | −7.3% | 22.9 | +20.2% |
| England | 1,340,527 | +9,925 | +0.7% | 22.8 | +17.9% |
Per 1,000 residents is a Briton News calculation using ONS mid-year population estimates. In Northern Ireland, more than 49,000 applicants were on the Northern Ireland Housing Executive waiting list at 31 March 2025; Scotland and Wales collect their own figures on different bases.
How long is the waiting list for a council house?
There is no single waiting time. The government does not publish an average wait, because how long you wait depends on your council’s allocation rules, your level of priority and the size of home you need. Councils sort applicants into priority bands, and those with an urgent need, such as people who are homeless, living in severely overcrowded or unsafe homes, or with serious medical needs, are offered homes first. Households in lower bands can wait many years, especially for larger family homes in high-demand areas such as London.
Being on a register also does not guarantee a home. The government notes that housing registers are not the same as the number of households in need: councils review their lists at different intervals, and some households may be on more than one list.
Which councils have the longest waiting lists?
The largest council waiting lists are in London. The table shows the 10 local authorities with the most households on their housing register at 31 March 2025.
| Rank | Council | Households on waiting list (2025) | 2024 |
|---|---|---|---|
| 1 | Newham | 41,223 | 38,417 |
| 2 | Brent | 36,534 | 33,263 |
| 3 | Lambeth | 29,187 | 38,131 |
| 4 | Tower Hamlets | 28,469 | 24,519 |
| 5 | Wakefield | 27,496 | 29,685 |
| 6 | Birmingham | 25,996 | 23,969 |
| 7 | Greenwich | 25,377 | 23,622 |
| 8 | Cornwall | 23,731 | 25,625 |
| 9 | Bristol | 22,464 | 21,430 |
| 10 | Leeds | 21,583 | 21,202 |
Large year-on-year swings, such as Lambeth’s fall from 38,131 to 29,187, often reflect councils reviewing their registers and removing applicants who no longer qualify or have not renewed, rather than a sudden change in need.
Why are waiting lists so long?
Demand for social housing far outstrips supply, especially where private housing is most expensive. In London, where average rents are £2,350 a month and the typical home costs over half a million pounds, many households on low and middle incomes have few alternatives, which helps explain why the capital’s register has grown 35.9 per cent since 2020. Our guides to average monthly rent by UK region and the average house price in every region show how sharply costs vary.
Waiting list totals can also change because of local policy. Since the Localism Act 2011, councils have been able to set their own qualification rules, such as how long applicants must have lived locally, so registers are not directly comparable between areas.
Frequently asked questions
How many people are on the council housing waiting list in England?
There were 1,340,527 households on local authority housing registers in England at 31 March 2025, according to MHCLG Live Table 600. That is 9,925 more than a year earlier, a rise of 0.7 per cent, and 17.9 per cent more than in 2020. London accounted for 341,009 of them.
How do I get higher priority on a council house waiting list?
Priority depends on your council’s allocation scheme, but people who are homeless, living in overcrowded or unsafe conditions, have serious medical or welfare needs, or need to move for hardship reasons usually receive more priority. Tell your council if your circumstances change, as this can move you into a higher band.
Which area has the longest council house waiting list?
Newham in east London had the largest council housing register in England at 31 March 2025, with 41,223 households, followed by Brent (36,534) and Lambeth (29,187). As a region, London had 341,009 households on waiting lists, equal to 37.4 for every 1,000 residents.
Methodology and official sources
- Source: Ministry of Housing, Communities and Local Government, Live Table 600: number of households on local authority housing registers (waiting lists), by district: England, from the Local Authority Housing Statistics collection, updated 25 June 2026, data at 31 March 2025.
- Population: ONS mid-year population estimates used for rates per 1,000 residents (Briton News calculation).
- Northern Ireland: NISRA, Northern Ireland Housing Executive waiting list figures at 31 March 2025.
- Caveats: registers are not a direct count of housing need; councils set their own qualifying criteria and review lists at different intervals. Figures for March 2026 are due between November 2026 and February 2027.
- Link: GOV.UK: Live tables on rents, lettings and tenancies.