Average Salary in the UK by Region: How Your Pay Compares Across Britain
The median full-time salary in the UK was £40,911 in April 2026. See average pay in every English region and UK nation, from London to the North East.

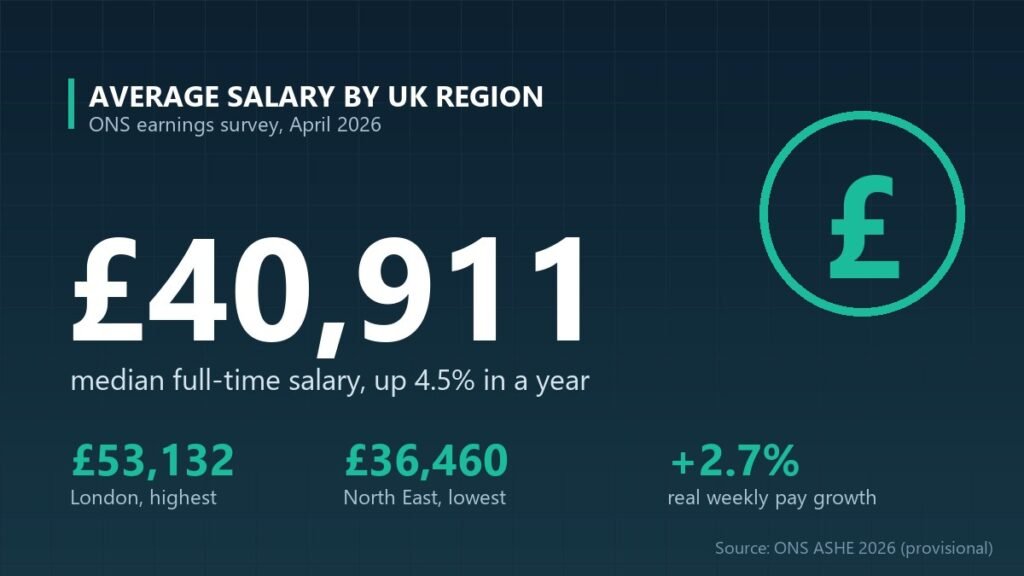
The average salary in the UK by region varies by more than £16,000 a year, from £36,460 in the North East to £53,132 in London, according to the Office for National Statistics. Across the UK, the median full-time employee earned £40,911 a year in April 2026, up 4.5 per cent on 2025. Weekly pay grew even faster, up 5.8 per cent to £811.20, and London saw the biggest rise of any region. Here is how pay compares in every English region and UK nation, part of our UK money and tax data coverage.
Key takeaways
- UK median: £40,911 a year for full-time employees, up 4.5% on 2025.
- Highest: London at £53,132, followed by the South East (£41,664) and Scotland (£41,466).
- Lowest: the North East at £36,460, though its annual pay grew 5.9%, faster than the UK average.
- Real terms: full-time weekly pay rose 2.7% after inflation (CPIH).
What is the average salary in the UK by region?
London has the highest average salary in the UK, with a median of £53,132 for full-time employees, while the North East has the lowest at £36,460. The table shows median full-time pay for every English region and UK nation in April 2026.
| Region / nation | Median annual pay (full-time) | Annual change | Median weekly pay (full-time) | Weekly pay change |
|---|---|---|---|---|
| London | £53,132 | +6.2% | £1,038.10 | +8.2% |
| South East | £41,664 | +3.9% | £821.60 | +6.0% |
| Scotland | £41,466 | +4.5% | £824.80 | +6.7% |
| East of England | £40,531 | +4.5% | £804.30 | +5.4% |
| South West | £39,078 | +5.0% | £776.20 | +6.4% |
| West Midlands | £38,628 | +4.3% | £765.80 | +4.8% |
| North West | £38,599 | +3.4% | £764.80 | +4.1% |
| Northern Ireland | £38,203 | +3.2% | £754.40 | +6.1% |
| Yorkshire and The Humber | £37,519 | +5.2% | £748.30 | +5.5% |
| Wales | £37,330 | +4.2% | £744.50 | +5.4% |
| East Midlands | £36,975 | +4.0% | £731.80 | +4.0% |
| North East | £36,460 | +5.9% | £722.70 | +5.7% |
| United Kingdom | £40,911 | +4.5% | £811.20 | +5.8% |
Figures are medians by place of work. Annual pay covers full-time employees who have been in the same job for at least a year, which is why annual and weekly growth rates differ. All 2026 figures are provisional.
Why do salaries differ so much between UK regions?
Regional pay gaps mostly reflect the mix of jobs in each area, the cost of living, and where high-paying employers choose to locate.
London’s job mix. London has the largest concentration of finance, legal, technology and head-office jobs in the UK. The capital’s median full-time salary is around 30 per cent above the UK figure, and the gap is even wider at the top end: London’s mean (average) full-time salary is £79,442, compared with a median of £53,132, showing how a smaller number of very high earners pull the average up.
Commuter belts and public sector pay. The South East and East of England benefit from high-paying jobs near London and in hubs such as Oxford, Cambridge and Reading. Scotland’s relatively high median, third in the UK, is supported by a large public sector and the energy industry. The ONS found public sector full-time weekly pay was £862.20 in April 2026, compared with £794.40 in the private sector.
Lower costs, lower pay. The North East, East Midlands and Wales have more jobs in manufacturing, care and retail, which pay less on average. The good news for lower-paid regions is that the gap is narrowing in places: annual pay in the North East grew 5.9 per cent, second only to London.
Is £40,000 a good salary in the UK?
Yes. A full-time salary of £40,000 is close to the UK median of £40,911, so it is roughly what a typical full-time worker earns. Outside London and the South East it is above the median: it beats the full-time median in eight of the 12 UK regions and nations, including the North East, East Midlands, Wales, Yorkshire and The Humber and the North West. In London, where the median is £53,132, £40,000 is below typical full-time pay.
How much is the average UK salary after tax?
On a salary of £40,911, a full-time employee in England, Wales or Northern Ireland takes home about £32,976 a year, or roughly £2,748 a month, after income tax and National Insurance.
That assumes the standard £12,570 Personal Allowance, 20 per cent basic-rate income tax and 8 per cent employee National Insurance, with no pension contributions, student loan repayments or other deductions. Scotland has its own income tax bands, so take-home pay there is slightly different.
Are wages rising faster than inflation?
Yes. Full-time median weekly pay rose 5.8 per cent in the year to April 2026, or 2.7 per cent after adjusting for inflation using CPIH. Part-time workers fared worse: their pay rose 2.9 per cent, which was a 0.1 per cent fall in real terms. London recorded the strongest weekly pay growth (8.2 per cent), while the East Midlands (4.0 per cent) and North West (4.1 per cent) saw the smallest increases.
Frequently asked questions
What is the average salary in the UK in 2026?
The median salary for full-time employees in the UK was £40,911 a year in April 2026, according to the ONS Annual Survey of Hours and Earnings. That is 4.5 per cent higher than in 2025. Median full-time weekly pay was £811.20, up 5.8 per cent. These 2026 figures are provisional.
Which UK region has the highest average salary?
London has the highest average salary, with median full-time pay of £53,132 a year in April 2026. The South East is second at £41,664 and Scotland third at £41,466. The North East has the lowest median at £36,460, about £16,700 less than London.
What is the difference between median and mean salary?
The median is the middle salary when everyone’s pay is lined up from lowest to highest, so it is not distorted by a few very high earners. The mean adds everyone’s pay and divides by the number of workers. The UK full-time mean was £52,109, well above the £40,911 median.
Methodology and official sources
- Source: Office for National Statistics, Employee earnings in the UK: 2026 (Annual Survey of Hours and Earnings, ASHE), released 22 October 2026.
- Dataset: ASHE Table 3 (region by occupation), 2026 provisional: Table 3.7a (annual gross pay) and Table 3.1a (weekly gross pay), full-time employees, by place of work.
- Reference period: pay period including 22 April 2026. Full-time means more than 30 paid hours a week (25 or more for teachers). Annual figures cover employees in the same job for at least a year.
- Take-home pay: Briton News calculation using the standard Personal Allowance, basic-rate income tax and employee Class 1 National Insurance rates for England, Wales and Northern Ireland.
- Caveats: 2026 estimates are provisional and will be revised in October 2027.
- Links: ONS: Employee earnings in the UK: 2026 and ASHE Table 3.