Average House Price in the UK by Region: Where Values Are Rising and Falling
The average UK house price was £273,000 in September 2026. See the latest figure for every English region and UK nation, from London to the North East.

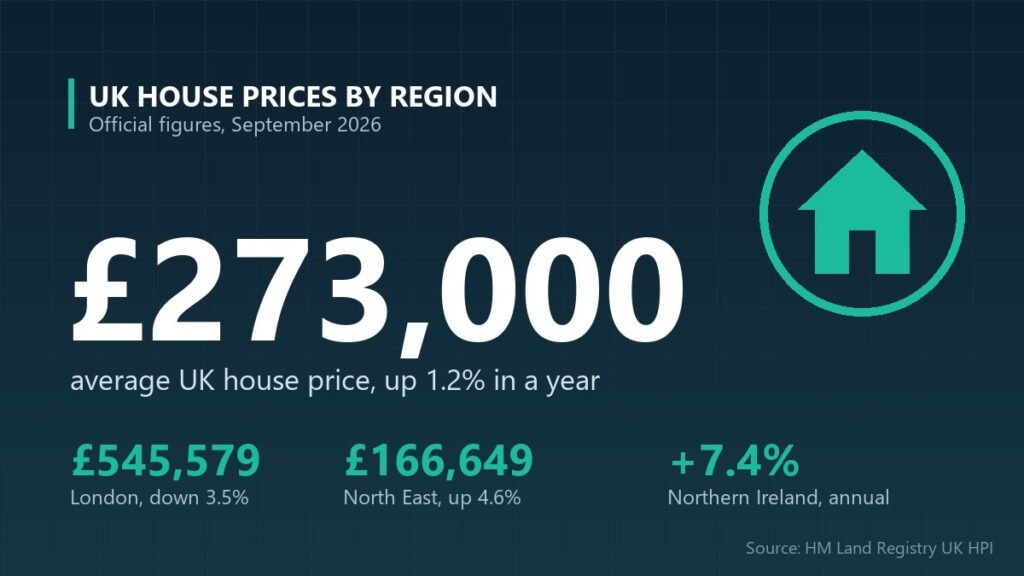
The average house price in the UK by region now ranges from about £167,000 in the North East to £546,000 in London, according to the official UK House Price Index. Across the UK as a whole, the typical home cost £273,000 in September 2026, up 1.2 per cent on a year earlier but down 0.5 per cent on the month. The gap between regions is closing slowly: the North East posted the fastest annual growth in England, while London and the South East were the only regions where prices fell. Below we break down every English region and UK nation, part of our wider UK property market data.
Key takeaways
- UK average: £273,000 in September 2026, up 1.2% over the year.
- Most expensive: London at £545,579, down 3.5% on a year earlier.
- Cheapest: the North East at £166,649, and also the fastest riser in England (+4.6%).
- Fastest growth in the UK: Northern Ireland, up 7.4% in the year to July–September 2026.
What is the average house price in the UK by region?
London has the highest average house price in the UK at £545,579, more than three times the North East’s £166,649. The table shows the latest official average for every English region and UK nation, with monthly and annual changes.
| Region / nation | Average price (Sep 2026) | Monthly change | Annual change |
|---|---|---|---|
| London | £545,579 | −1.4% | −3.5% |
| South East | £378,915 | −0.3% | −0.2% |
| East of England | £338,357 | −0.2% | +0.7% |
| South West | £301,616 | −0.9% | +0.3% |
| West Midlands | £250,355 | −0.4% | +0.9% |
| East Midlands | £242,863 | −0.1% | +1.3% |
| North West | £220,477 | −0.5% | +3.2% |
| Wales | £214,548 | −1.2% | +1.8% |
| Yorkshire and The Humber | £210,799 | +0.4% | +2.9% |
| Northern Ireland* | £207,272 | +2.7% (quarterly) | +7.4% |
| Scotland | £197,975 | −0.7% | +2.3% |
| North East | £166,649 | +0.1% | +4.6% |
| England | £292,998 | −0.4% | +0.8% |
| United Kingdom | £273,000 | −0.5% | +1.2% |
*Northern Ireland figures are published quarterly and cover July to September 2026. September figures are provisional and may be revised in later releases.
Why are house prices so different across UK regions?
Regional house prices largely reflect local wages, the supply of homes and how much demand is concentrated in a few places. Three forces explain most of the current picture.
London’s long boom is unwinding. London prices are now £23,000 below their recent peak of £569,000 in July 2025. The fall is sharpest in inner London, where prices dropped 7.2 per cent over the year, the steepest decline in the series, while outer London was almost flat at −0.1 per cent. Flats, which make up a large share of London’s homes, have been hit hardest: London flat prices fell 6.3 per cent in the year to September, the 14th month in a row of annual falls.
Cheaper regions have more room to grow. With the lowest prices in England, the North East, North West and Yorkshire and The Humber remain within reach of more buyers on local salaries. These three regions recorded the strongest annual growth in England, at 4.6, 3.2 and 2.9 per cent respectively.
The devolved nations are on their own cycles. Northern Ireland has posted the fastest growth in the UK, up 7.4 per cent over the year, but from a lower base. Scotland’s average of £197,975 remains below every English region except the North East.
Which type of property has risen most in value?
Semi-detached homes have risen fastest over the past year, while flats have fallen in value. Across the UK, the average semi-detached house rose 2.6 per cent to £278,368, and flats and maisonettes fell 2.3 per cent to £191,864.
| Property type (UK) | Sep 2026 | Sep 2025 | Annual change |
|---|---|---|---|
| Detached | £447,677 | £440,554 | +1.6% |
| Semi-detached | £278,368 | £271,431 | +2.6% |
| Terraced | £231,525 | £227,384 | +1.8% |
| Flat or maisonette | £191,864 | £196,309 | −2.3% |
The weakness in flats helps explain why London and the South East, where flats make up a bigger share of sales, are lagging the rest of the country.
How much does a first-time buyer pay on average?
The average first-time buyer in Great Britain paid £229,110 in September 2026, up 1.0 per cent on a year earlier. Former owner-occupiers, who are typically moving up the ladder, paid an average of £335,977, also up 1.0 per cent. Northern Ireland is not included in these figures.
HM Land Registry notes that it found an error in how first-time buyer and former owner-occupier prices were calculated before January 2026, so comparisons with older published figures should be treated with caution.
What does this mean for buyers in London?
Buyers in London now face lower prices than a year ago, particularly for flats and homes in inner London. The average London home is 3.5 per cent cheaper than in September 2025 and back at its March 2026 low. That still leaves the capital twice as expensive as the UK average, so affordability remains the main barrier, but buyers have more room to negotiate than at any point since the July 2025 peak.
Is the housing market slowing down?
Activity is broadly stable rather than collapsing. HMRC estimates there were about 95,000 residential property sales in September 2026 (seasonally adjusted), 0.4 per cent fewer than a year earlier. Prices dipped 0.5 per cent on the month nationally, but annual growth of 1.2 per cent shows values are still edging up outside London and the South East.
Frequently asked questions
What is the average house price in the UK right now?
The average UK house price was £273,000 in September 2026, according to the UK House Price Index published by HM Land Registry on 18 November 2026. That is 1.2 per cent higher than a year earlier, but 0.5 per cent lower than in August 2026. These latest figures are provisional.
Which UK region has the cheapest houses?
The North East of England has the cheapest homes, with an average price of £166,649 in September 2026. Scotland is next at £197,975, followed by Northern Ireland at £207,272. The North East was also England’s fastest-growing region, with prices up 4.6 per cent over the year.
Are house prices falling in London?
Yes. London’s average house price fell 3.5 per cent in the year to September 2026, to £545,579. Inner London fell 7.2 per cent, the largest annual drop on record in the series, while outer London was almost unchanged. London prices are now £23,000 below their July 2025 peak.
Methodology and official sources
- Source: UK House Price Index: September 2026, published 18 November 2026 by HM Land Registry. The index is calculated by the Office for National Statistics and Land & Property Services Northern Ireland, using data from HM Land Registry, Registers of Scotland and LPS.
- Reference period: September 2026 for England, Scotland and Wales; July to September 2026 (Quarter 3) for Northern Ireland. Recent months are provisional and likely to be revised.
- Sales: transaction estimate from HMRC, seasonally adjusted, for residential sales of £40,000 or more.
- Next update: October 2026 figures are due on 16 December 2026, and this page will be updated.
- Links: UK House Price Index summary: September 2026 and UK House Price Index England: September 2026.