Ofgem Price Cap by Region: Daily Standing Charges and Unit Rates Explained
Why are standing charges different by region? See Ofgem's October to December 2026 price cap rates for all 14 regions, from London to Merseyside and Northern Wales.

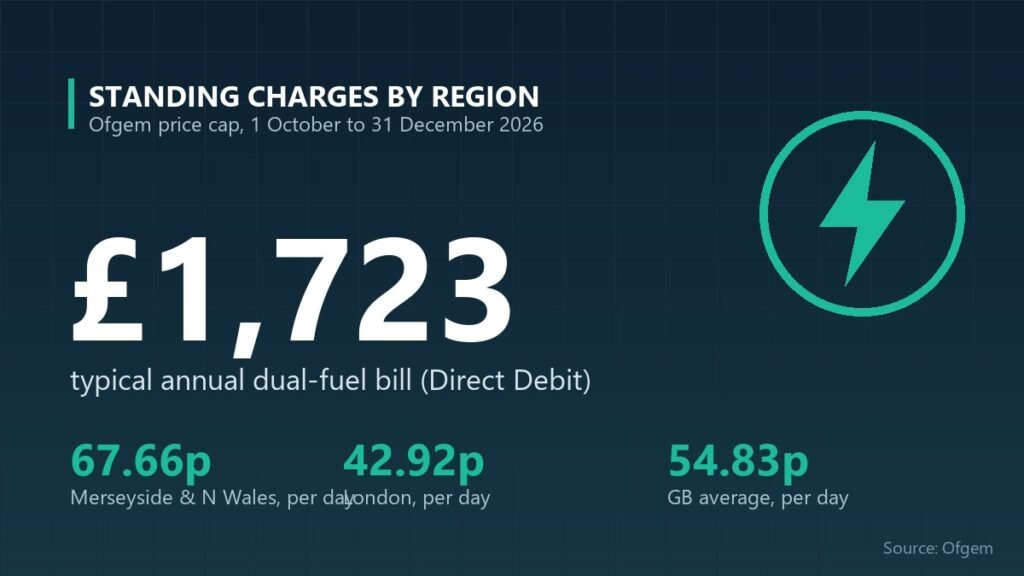
Why are standing charges different by region? Under Ofgem’s energy price cap, every household in Great Britain pays a daily fixed charge for electricity and gas, but the electricity charge varies from 42.92p a day in London to 67.66p in Merseyside and Northern Wales. That gap is worth about £90 a year on electricity alone. For 1 October to 31 December 2026, the cap for a typical household paying by Direct Debit is £1,723 a year, up 4 per cent on the previous period. Below we set out the rates for all 14 regions, part of our UK money and household bills coverage.
Key takeaways
- Typical bill: £1,723 a year for dual fuel paid by Direct Debit, 1 October to 31 December 2026.
- Electricity (GB average): 26.32p per kWh and a 54.83p daily standing charge.
- Gas (GB average): 7.97p per kWh and a 29.68p daily standing charge.
- Biggest gap: electricity standing charges range from 42.92p a day (London) to 67.66p (Merseyside and Northern Wales).
What are the price cap rates in each region?
Merseyside and Northern Wales has the highest electricity standing charge and unit rate in Great Britain, while London has the lowest standing charge. The table shows Direct Debit rates for single-rate electricity and gas in all 14 price cap regions for 1 October to 31 December 2026.
| Region | Electricity standing charge (p/day) | Electricity unit rate (p/kWh) | Gas standing charge (p/day) | Gas unit rate (p/kWh) |
|---|---|---|---|---|
| Merseyside and Northern Wales | 67.66 | 27.86 | 30.08 | 7.91 |
| Yorkshire | 61.67 | 25.60 | 29.77 | 7.90 |
| North Eastern England | 61.58 | 25.46 | 29.79 | 7.92 |
| Southern Scotland | 61.41 | 26.11 | 29.89 | 7.87 |
| West Midlands | 57.23 | 25.60 | 29.71 | 7.90 |
| South Western England | 55.58 | 26.58 | 29.31 | 8.12 |
| Southern Wales | 55.41 | 26.55 | 29.96 | 8.09 |
| Northern Scotland | 55.14 | 26.35 | 29.87 | 7.87 |
| South Eastern England | 52.32 | 26.88 | 29.26 | 8.05 |
| Eastern England | 51.84 | 26.61 | 29.34 | 7.91 |
| East Midlands | 51.45 | 25.36 | 29.41 | 7.82 |
| Southern England | 47.81 | 26.47 | 29.16 | 8.17 |
| North Western England | 45.68 | 26.49 | 29.81 | 7.86 |
| London | 42.92 | 26.60 | 30.20 | 8.15 |
| Great Britain average | 54.83 | 26.32 | 29.68 | 7.97 |
Rates include 5 per cent VAT on gas. According to Ofgem, there is no VAT on electricity from 1 October 2026 to 31 March 2027, so electricity costs cannot be compared directly with earlier periods. Customers on standard credit or prepayment meters have different rates.
Why are standing charges different by region?
Standing charges differ because the cost of running and upgrading the local energy network, and the number of people sharing that cost, varies from place to place. Ofgem says the standing charge in each region is calculated based on:
- how many people live in the region;
- how much energy is used in the region on average;
- the amount of energy the supplier needs to buy;
- the cost of building and improving the energy network.
In practice, regions where the local network costs more to build and maintain, or where those costs are shared among fewer homes, tend to have higher electricity standing charges. Densely populated London has the lowest electricity standing charge, while Merseyside and Northern Wales, Yorkshire, North Eastern England and Southern Scotland all pay more than 61p a day.
Gas standing charges vary far less, from 29.16p a day in Southern England to 30.20p in London, because gas network costs are spread more evenly across the country.
How much do standing charges cost per year in each region?
At October to December 2026 rates, a dual-fuel household pays between about £267 and £357 a year in standing charges alone, before using any energy. The figures below multiply each daily charge by 365 days.
| Region | Electricity standing charge per year | Gas standing charge per year | Total per year |
|---|---|---|---|
| Merseyside and Northern Wales | £246.96 | £109.79 | £356.75 |
| Yorkshire | £225.10 | £108.66 | £333.76 |
| North Eastern England | £224.77 | £108.73 | £333.50 |
| Southern Scotland | £224.15 | £109.10 | £333.25 |
| West Midlands | £208.89 | £108.44 | £317.33 |
| Southern Wales | £202.25 | £109.35 | £311.60 |
| Northern Scotland | £201.26 | £109.03 | £310.29 |
| South Western England | £202.87 | £106.98 | £309.85 |
| South Eastern England | £190.97 | £106.80 | £297.77 |
| Eastern England | £189.22 | £107.09 | £296.31 |
| East Midlands | £187.79 | £107.35 | £295.14 |
| Southern England | £174.51 | £106.43 | £280.94 |
| North Western England | £166.73 | £108.81 | £275.54 |
| London | £156.66 | £110.23 | £266.89 |
| Great Britain average | £200.13 | £108.33 | £308.46 |
Standing charges are fixed, so they make up a bigger share of the bill for homes that use little energy, such as single-person households or well-insulated flats.
Have standing charges gone up or down?
Electricity standing charges have fallen, while gas standing charges have risen slightly. The GB average electricity standing charge dropped from 57.19p a day in July to September 2026 to 54.83p from October, and every region saw a cut. The gas standing charge rose from 29.04p to 29.68p, and the gas unit rate rose from 7.33p to 7.97p per kWh, which helps explain why the overall cap rose by 4 per cent.
How can I find out which region I am in?
Your price cap region is set by your local electricity network area, not by your county or council. The quickest way to check is to look at your energy bill, which shows your tariff rates, or to ask your supplier. For example, much of north Wales is in the Merseyside and Northern Wales region, while south Wales is in the Southern Wales region.
Frequently asked questions
What is the Ofgem price cap from October 2026?
From 1 October to 31 December 2026, the energy price cap is £1,723 a year for a typical household paying by Direct Debit, up 4 per cent on July to September. The average electricity rate is 26.32p per kWh with a 54.83p daily standing charge, and gas is 7.97p per kWh with a 29.68p charge.
Which region has the highest standing charge?
Merseyside and Northern Wales has the highest electricity standing charge in Great Britain, at 67.66p a day for Direct Debit customers from October 2026, about £247 a year. It also has the highest electricity unit rate, at 27.86p per kWh. London has the lowest electricity standing charge, at 42.92p a day.
Does the price cap limit my total bill?
No. The price cap limits the unit rates and standing charges suppliers can charge on standard variable tariffs, not your total bill. If you use more energy than a typical household, you will pay more than £1,723 a year, and if you use less, you will pay less. Fixed tariffs are not covered by the cap.
Methodology and official sources
- Source: Ofgem, Energy price cap unit rates and standing charges, regional tables for Direct Debit customers, 1 October to 31 December 2026 (with 1 July to 30 September 2026 for comparison).
- Coverage: England, Scotland and Wales only. Northern Ireland has a separate energy market and is not covered by the Ofgem price cap.
- Rates: single-rate electricity and gas, Direct Debit, rounded to two decimal places, including 5% VAT on gas and no VAT on electricity for October 2026 to March 2027, as stated by Ofgem.
- Annual standing charges: Briton News calculation, daily rate multiplied by 365.
- Link: Ofgem: energy price cap unit rates and standing charges.