Safest Counties in England and Wales: Crime Rates Per 1,000 Residents
North Yorkshire has the lowest crime rate in England and Wales at 52.1 crimes per 1,000 people. See the safest and highest-crime areas and every region.

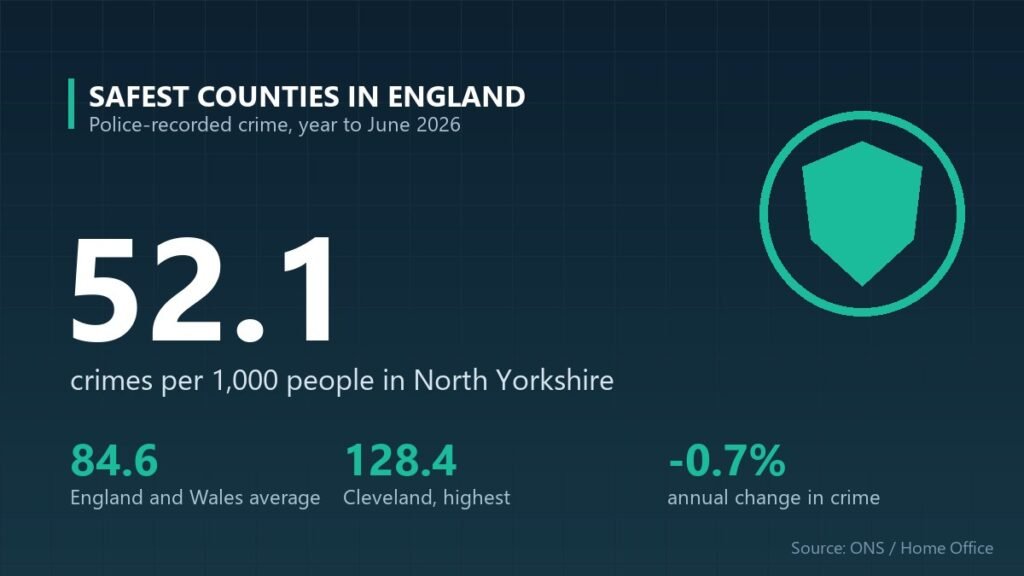
What are the safest counties in England? On police-recorded crime, North Yorkshire is the safest area in England and Wales, with 52.1 crimes per 1,000 residents in the year to June 2026, followed by Wiltshire (56.0) and Suffolk (56.4), according to the Office for National Statistics. That is well under the England and Wales average of 84.6, and less than half the rate in Cleveland, which has the highest crime rate at 128.4. Comparing crimes per 1,000 people, rather than total numbers, lets small rural counties and big cities be judged fairly. Here is the full ranking, part of our coverage of how UK public services and safety compare where you live.
Key takeaways
- Safest area: North Yorkshire, with 52.1 recorded crimes per 1,000 people.
- Highest crime rate: Cleveland, with 128.4 crimes per 1,000 people.
- England and Wales average: 84.6 crimes per 1,000 people, excluding fraud.
- Trend: total police-recorded crime fell 0.7% in the year to June 2026.
What are the safest counties in England and Wales?
North Yorkshire, Wiltshire and Suffolk have the lowest crime rates in England and Wales. The table ranks the 10 police force areas with the fewest recorded crimes per 1,000 residents in the year ending June 2026.
| Rank | Police force area | Crimes per 1,000 people | Violent crime per 1,000 | Annual change in crime |
|---|---|---|---|---|
| 1 | North Yorkshire | 52.1 | 21.5 | −1.3% |
| 2 | Wiltshire | 56.0 | 23.7 | +5.0% |
| 3 | Suffolk | 56.4 | 23.2 | +1.7% |
| 4 | West Mercia | 58.8 | 24.5 | −1.8% |
| 5 | Dorset | 58.9 | 22.8 | −7.0% |
| 6 | Surrey | 59.0 | 22.6 | −0.4% |
| 7 | Norfolk | 61.2 | 26.2 | −1.7% |
| 8 | Warwickshire | 61.6 | 23.2 | +1.2% |
| 9 | Thames Valley | 64.1 | 24.1 | −0.3% |
| 10 | Gloucestershire | 65.3 | 25.8 | −3.5% |
Rates are for total police-recorded crime excluding fraud. West Mercia covers Herefordshire, Shropshire, Telford and Wrekin and Worcestershire, and Thames Valley covers Berkshire, Buckinghamshire and Oxfordshire. The City of London is excluded because its tiny resident population distorts rates.
Which areas have the highest crime rates?
Cleveland, which covers Hartlepool, Middlesbrough, Redcar and Cleveland and Stockton-on-Tees, has the highest recorded crime rate in England and Wales, at 128.4 crimes per 1,000 people. It was also one of the few areas where crime rose sharply, up 9.4 per cent over the year.
| Police force area | Crimes per 1,000 people | Violent crime per 1,000 | Burglaries per 1,000 households | Annual change |
|---|---|---|---|---|
| Cleveland | 128.4 | 45.3 | 10.1 | +9.4% |
| West Yorkshire | 106.8 | 44.5 | 10.0 | −5.4% |
| Greater Manchester | 103.1 | 41.4 | 6.8 | −1.7% |
| South Yorkshire | 101.8 | 37.9 | 9.5 | −1.1% |
| West Midlands | 100.9 | 40.3 | 8.6 | +0.7% |
| Metropolitan Police (London) | 100.6 | 27.9 | 9.2 | −2.7% |
| Humberside | 97.7 | 39.1 | 8.2 | +2.0% |
| Gwent | 96.8 | 38.7 | 6.1 | +2.0% |
How do crime rates compare by region?
The East of England and the South East have the lowest crime rates of any English region, while London and the North East have the highest. The table shows recorded crime per 1,000 people for each English region and Wales.
| Region / nation | Crimes per 1,000 people | Violent crime per 1,000 | Burglaries per 1,000 households | Annual change |
|---|---|---|---|---|
| East of England | 68.4 | 27.4 | 4.3 | +0.6% |
| South East | 70.0 | 27.1 | 4.1 | −2.4% |
| South West | 72.4 | 30.3 | 4.4 | −0.4% |
| East Midlands | 76.5 | 29.8 | 5.3 | −0.8% |
| Wales | 79.6 | 33.0 | 3.8 | −1.4% |
| West Midlands | 83.0 | 33.7 | 6.6 | +1.1% |
| North West | 89.2 | 37.1 | 5.2 | −0.1% |
| Yorkshire and The Humber | 95.8 | 38.5 | 8.5 | −2.7% |
| North East | 99.8 | 35.8 | 8.0 | +3.6% |
| London | 101.4 | 28.0 | 9.2 | −2.6% |
| England and Wales | 84.6 | 31.7 | 5.9 | −0.7% |
Police-recorded crime covers England and Wales only. Scotland and Northern Ireland publish their own crime statistics using different counting rules.
Why are some counties safer than others?
Crime rates tend to be lowest in rural and more affluent areas and highest in large cities and some former industrial towns. Cities have more shops, nightlife, transport hubs and people passing through, which creates more opportunities for theft and violence, and crimes committed against visitors are counted against the local population. London’s theft rate of 46.3 per 1,000 people is the highest of any region, reflecting the capital’s huge numbers of commuters and tourists, even though its violent crime rate (28.0) is below the national average.
Rural forces such as North Yorkshire, Wiltshire and Suffolk combine smaller towns with low population density, which helps keep rates down. But low crime is not only rural: Surrey, a busy commuter county next to London, has the sixth-lowest rate.
Is recorded crime a reliable measure of safety?
It is a useful guide but not a perfect one. Police-recorded crime only includes offences reported to and recorded by the police, and changes in recording practices can affect the figures. The ONS says the Crime Survey for England and Wales, which asks people directly about their experiences, is a better guide to long-term trends for the crimes it covers. Rates per 1,000 people are best used to compare areas over the same period, as in this article.
Frequently asked questions
What is the safest county in England?
North Yorkshire had the lowest police-recorded crime rate in England and Wales in the year to June 2026, with 52.1 crimes per 1,000 residents, according to the ONS. Wiltshire (56.0) and Suffolk (56.4) were next. The England and Wales average was 84.6 crimes per 1,000 people, excluding fraud.
Which area has the highest crime rate in England?
Cleveland had the highest police-recorded crime rate in England and Wales in the year to June 2026, at 128.4 crimes per 1,000 people, and crime there rose 9.4 per cent. West Yorkshire (106.8) and Greater Manchester (103.1) had the next highest rates.
Is crime going down in England and Wales?
Police-recorded crime, excluding fraud, fell 0.7 per cent in England and Wales in the year to June 2026, to about 5.25 million offences. Theft offences fell 5.3 per cent, but robbery rose 9.7 per cent and stalking and harassment rose 3 per cent. Homicides fell 1 per cent to 512.
Methodology and official sources
- Source: Office for National Statistics, Crime in England and Wales: year ending June 2026, released 22 October 2026, and the accompanying Police Force Area data tables (Tables P1 to P3).
- Measure: police-recorded crime from the Home Office, excluding fraud, per 1,000 population; residential burglary per 1,000 households. Police recorded crime statistics are official statistics, not accredited official statistics.
- Areas: the 42 territorial police force areas in England and Wales, excluding the City of London; most correspond to a county or group of counties.
- Next update: crime statistics for the year ending September 2026 are due on 28 January 2027.
- Link: ONS: Crime in England and Wales, Police Force Area data tables.