Cost of Living vs Salary by UK Region: Where Your Pay Goes Furthest
London pays the most but leaves typical earners with about £925 a month after rent and council tax. See how salary compares with living costs in every UK region.

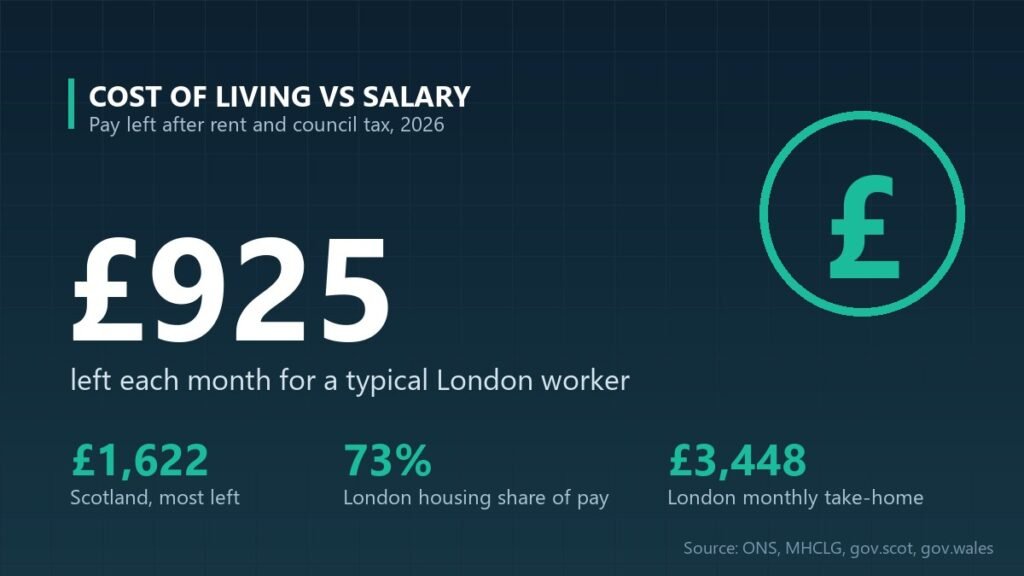
Comparing the cost of living vs salary across UK regions shows that the highest-paid places are not where your money goes furthest. A full-time worker on London’s median salary of £53,132 takes home about £3,448 a month, the most in the UK, but after paying the average London rent and council tax they have around £925 a month left, the least of any region. In Scotland, the North East and Wales, typical earners are left with roughly £1,480 to £1,620. Briton News combined official figures on pay, rent and council tax to compare every region, part of our UK regions data coverage.
Key takeaways
- Most left over: Scotland, about £1,622 a month after average rent and council tax.
- Least left over: London, about £925 a month, despite the highest pay.
- Housing burden: rent and council tax take 73% of take-home pay in London, against about 41% in the North East, Wales and Scotland.
- Typical full-time take-home: £2,481 a month in the North East up to £3,448 in London.
How does the cost of living compare with salaries in each UK region?
Scotland, Wales and the North East leave typical full-time earners with the most money after housing costs, while London and the South East leave the least. The table shows median full-time pay, estimated monthly take-home pay, average private rent and Band D council tax for each region.
| Region / nation | Median full-time salary | Monthly take-home | Average rent | Council tax (Band D, monthly) | Left each month | Rent + council tax as share of take-home |
|---|---|---|---|---|---|---|
| Scotland | £41,466 | £2,775 | £1,015 | £138* | £1,622 | 41.5% |
| Wales | £37,330 | £2,533 | £849 | £190 | £1,494 | 41.0% |
| North East | £36,460 | £2,481 | £793 | £211 | £1,477 | 40.5% |
| Yorkshire and The Humber | £37,519 | £2,544 | £872 | £199 | £1,473 | 42.1% |
| West Midlands | £38,628 | £2,611 | £983 | £199 | £1,429 | 45.3% |
| North West | £38,599 | £2,609 | £979 | £207 | £1,424 | 45.4% |
| East Midlands | £36,975 | £2,512 | £928 | £205 | £1,379 | 45.1% |
| East of England | £40,531 | £2,725 | £1,302 | £200 | £1,224 | 55.1% |
| South West | £39,078 | £2,638 | £1,254 | £212 | £1,171 | 55.6% |
| South East | £41,664 | £2,793 | £1,448 | £206 | £1,139 | 59.2% |
| London | £53,132 | £3,448 | £2,350 | £172 | £925 | 73.2% |
| Northern Ireland | £38,203 | £2,585 | £876 | n/a** | – | – |
*Scotland’s council tax excludes separate water and sewerage charges. **Northern Ireland uses domestic rates instead of council tax, so it is not ranked; after average rent alone, a typical earner there has about £1,709 a month left. Take-home pay assumes one full-time earner on the regional median with standard income tax and National Insurance (Scottish income tax rates in Scotland) and no pension or student loan deductions. Rent is the average for all private rented homes, and council tax is the average Band D charge without discounts.
Why do higher salaries not always mean a better standard of living?
Housing costs rise much faster than pay in expensive areas. London’s median full-time salary is £16,672 a year higher than the North East’s, but its average rent is almost three times as high: £2,350 a month against £793. After income tax and National Insurance, the London worker’s extra pay is worth about £967 a month, while the extra rent is £1,557.
The South East, South West and East of England show a similar, milder pattern. Salaries there are only slightly above the national median, but rents of £1,250 to £1,450 a month take more than half of typical take-home pay once council tax is added.
At the other end, Scotland combines the third-highest median salary in the UK (£41,466) with relatively moderate rents and the lowest average Band D council tax, giving it the most money left over on these measures. Scottish workers pay slightly more income tax than those elsewhere on the same salary, but lower housing costs more than make up for it.
Where does your salary go furthest in the UK?
On these figures, a typical full-time worker’s salary goes furthest in Scotland, Wales, the North East and Yorkshire and The Humber, where around £1,470 to £1,620 is left each month after rent and council tax. That remaining money still has to cover energy, food, transport and other bills, so the gap between regions matters: a typical earner in Scotland has around £700 a month more left than one in London.
What about households that own their home?
This comparison is based on renting, which is how many younger workers live. Homeowners face different costs: mortgage repayments depend on when they bought and their interest rate, and outright owners have no housing payment at all. But the regional pattern for buyers is similar, because house prices are also highest in London and the south.
Frequently asked questions
Which UK region has the best salary to cost of living ratio?
On Briton News calculations using official pay, rent and council tax data, Scotland leaves a typical full-time worker with the most money after housing costs, about £1,622 a month. Wales, the North East and Yorkshire and The Humber are close behind, each at around £1,470 to £1,500.
Is it worth living in London for a higher salary?
Not on average. London’s median full-time salary of £53,132 is the highest in the UK, but after average rent of £2,350 and council tax, a typical worker has about £925 a month left, the least of any region. Higher London pay can pay off for those with lower housing costs or much higher salaries.
How much of my salary should go on rent?
A common rule of thumb is to spend no more than about a third of take-home pay on rent. On our figures, the average rent takes about a third of typical take-home pay in Northern Ireland and the North East, around 37 per cent in Scotland, and 68 per cent in London.
Methodology and official sources
- Salaries: Office for National Statistics, Annual Survey of Hours and Earnings 2026 (provisional), Table 3.7a: median annual gross pay for full-time employees by region (workplace), April 2026.
- Rents: ONS, Price Index of Private Rents, average monthly private rent, October 2026 (August 2026 for Northern Ireland), published 18 November 2026.
- Council tax: MHCLG, Council Tax levels set by local authorities in England 2026 to 2027 (regional averages are Briton News tax-base-weighted calculations); Welsh Government, Council Tax levels: April 2026 to March 2027 (£2,283); Scottish Government, Council Tax by band 2026-27 (£1,653, excluding water and sewerage).
- Take-home pay: Briton News calculation using 2026-27 Personal Allowance, income tax and employee National Insurance rates, with Scottish income tax bands applied in Scotland.
- Limitations: an illustration for a single full-time earner renting an average home. It excludes energy, transport, food, childcare and other costs, which also vary by region.