Average UK Household Spending Per Week: Where British Families Spend Most
UK households spent an average of £676.60 a week in 2024-25, led by housing, transport and recreation. See spending by category, region and income.

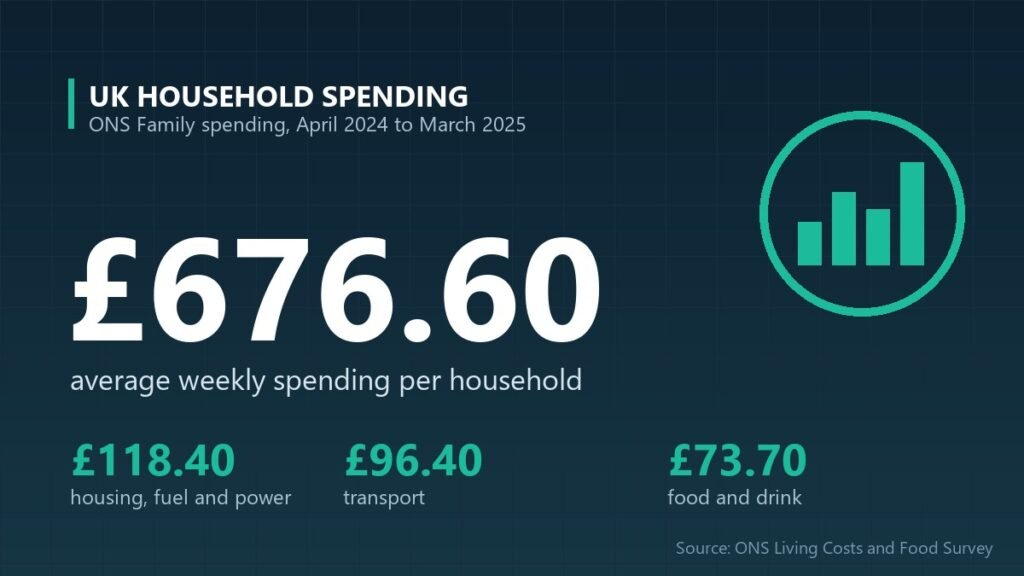
How much does the average UK household spend? According to the Office for National Statistics, UK households spent an average of £676.60 a week in the financial year ending March 2025, or about £35,200 a year. Of that, £582.50 went on everyday goods and services, with housing, fuel and power the biggest single item at £118.40 a week, followed by transport (£96.40) and recreation and culture (£82.10). Spending varies hugely by income and region: the richest fifth of households spend almost two and a half times as much as the poorest fifth. Here is the full breakdown, part of our UK money and household finances coverage.
Key takeaways
- Average weekly spending: £676.60 per UK household (April 2024 to March 2025).
- Biggest costs: housing, fuel and power (£118.40), transport (£96.40) and recreation (£82.10).
- Highest-spending region: the South East, at £724.20 a week (three-year average); lowest: the North East at £505.50.
- Income gap: the richest fifth spend £904.80 a week on goods and services, against £366.10 for the poorest fifth.
What does the average UK household spend each week?
The average UK household spent £582.50 a week on goods and services in the financial year ending 2025, plus £94.10 on other items such as mortgage interest, council tax and holiday spending, giving a total of £676.60. The table breaks spending down by category.
| Category | Average weekly spend | Share of goods and services |
|---|---|---|
| Housing (net), fuel and power | £118.40 | 20.3% |
| Transport | £96.40 | 16.5% |
| Recreation and culture | £82.10 | 14.1% |
| Food and non-alcoholic drinks | £73.70 | 12.7% |
| Miscellaneous goods and services | £49.80 | 8.5% |
| Restaurants and hotels | £49.20 | 8.4% |
| Household goods and services | £40.60 | 7.0% |
| Communication | £22.40 | 3.8% |
| Clothing and footwear | £18.00 | 3.1% |
| Health | £11.90 | 2.0% |
| Alcoholic drink and tobacco | £11.30 | 1.9% |
| Education | £8.70 | 1.5% |
| All goods and services | £582.50 | 100% |
| Other expenditure items | £94.10 | – |
| Total expenditure | £676.60 | – |
“Housing (net)” mainly covers rent and repairs; mortgage payments are not counted as spending on goods, although mortgage interest and council tax are included in “other expenditure items”.
How much do households spend in each region?
Households in the South East, East of England and London spend the most, while those in the North East and Scotland spend the least. Because regional samples are smaller, the ONS publishes regional spending as a three-year average (April 2022 to March 2025).
| Region / nation | Total weekly spending | Housing, fuel and power | Transport | Food and drink | Spending per person |
|---|---|---|---|---|---|
| South East | £724.20 | £122.40 | £110.30 | £74.40 | £305.30 |
| East of England | £698.40 | £112.50 | £107.30 | £74.20 | £297.50 |
| London | £695.90 | £182.20 | £71.40 | £68.70 | £288.20 |
| South West | £677.90 | £111.90 | £98.30 | £73.00 | £295.70 |
| Northern Ireland | £583.80 | £76.70 | £94.00 | £80.90 | £239.00 |
| West Midlands | £581.50 | £98.50 | £89.10 | £66.40 | £241.70 |
| Yorkshire and The Humber | £580.10 | £97.40 | £82.80 | £66.00 | £252.70 |
| Wales | £574.00 | £94.30 | £84.70 | £66.10 | £254.60 |
| East Midlands | £572.90 | £103.00 | £88.50 | £69.30 | £240.30 |
| North West | £554.70 | £95.00 | £72.80 | £66.40 | £243.00 |
| Scotland | £528.00 | £90.00 | £78.70 | £64.80 | £250.80 |
| North East | £505.50 | £82.10 | £69.00 | £60.50 | £228.90 |
| United Kingdom | £622.60 | £112.50 | £88.00 | £69.20 | £268.10 |
Regional figures are three-year averages and are not directly comparable with the single-year UK total of £676.60. Year-on-year regional changes are not published.
Why does household spending vary by region?
Spending follows income and housing costs. London households spend £182.20 a week on housing, fuel and power, almost double the UK average of £112.50, reflecting the capital’s high rents. But Londoners spend the least on transport of any region (£71.40), as fewer households run cars and public transport is widely available.
Households in the South East and East of England spend the most on transport, at over £107 a week, reflecting longer journeys and higher car use in commuter areas. Northern Ireland has the lowest housing costs (£76.70) but the highest weekly spend on food and drink (£80.90). Running a home is expensive everywhere, and our guides to energy standing charges by region and Band D council tax by region show how much those fixed bills vary.
How does spending differ between rich and poor households?
The richest fifth of households spend £904.80 a week on goods and services, almost two and a half times the £366.10 spent by the poorest fifth. The gap is biggest on discretionary spending.
| Category (weekly) | Poorest fifth | Middle fifth | Richest fifth |
|---|---|---|---|
| Housing, fuel and power | £104.70 | £123.80 | £133.70 |
| Food and non-alcoholic drinks | £61.80 | £74.70 | £85.50 |
| Transport | £41.80 | £89.70 | £174.60 |
| Recreation and culture | £36.80 | £81.80 | £145.10 |
| Restaurants and hotels | £21.90 | £44.60 | £94.80 |
| All goods and services | £366.10 | £559.50 | £904.80 |
Essentials take up a far larger share of poorer households’ budgets. Housing, fuel and power alone account for 29 per cent of the poorest fifth’s spending on goods and services, against 15 per cent for the richest fifth.
Frequently asked questions
How much does the average UK household spend per month?
The average UK household spent £676.60 a week in the financial year ending March 2025, according to the ONS. That is roughly £2,930 a month or about £35,200 a year. It includes £582.50 a week on goods and services and £94.10 on other items such as mortgage interest and council tax.
What do UK households spend the most on?
Housing, fuel and power is the biggest category of household spending, at £118.40 a week in the financial year ending 2025. Transport is second at £96.40, followed by recreation and culture at £82.10 and food and non-alcoholic drinks at £73.70 a week.
How much does the average household spend on food?
UK households spent an average of £73.70 a week on food and non-alcoholic drinks in the financial year ending 2025, plus £49.20 at restaurants and hotels. The poorest fifth of households spent £61.80 a week on food and drink at home, and the richest fifth £85.50.
Methodology and official sources
- Source: Office for National Statistics, Family spending in the UK: April 2024 to March 2025, released 11 June 2026, from the Living Costs and Food Survey.
- Datasets: Family spending workbook 1 (Table A1, detailed expenditure; Table 3.1E5, expenditure by equivalised disposable income quintile) and workbook 3 (Table A33, expenditure by region, three-year average for financial years ending 2023 to 2025).
- Income groups: households ranked by equivalised disposable income (OECD-modified scale), split into fifths.
- Calculations: monthly and annual figures and percentage shares are Briton News calculations from the published weekly averages.
- Link: ONS: Family spending in the UK, April 2024 to March 2025.